



You've got bookings coming through five different channels. Payments hitting three bank accounts. Suppliers sending invoices weeks after trips complete. Commission calculations that change based on volume thresholds you hit (or miss) each quarter.
And somewhere between that initial booking and final settlement, margins just... evaporate.
Last month I helped a mid-sized operator in Colorado rebuild their entire data tracking after they discovered their actual margins were 8% lower than what their booking system showed. Not because of fraud or errors — just pure operational blindness. They were running reports on gross bookings while hemorrhaging cash through supplier markups, channel fees, and settlement delays they couldn't even see.
The painful part? They had all the data. It just lived in twelve different places and nobody could connect it into a single view that actually meant something.
The booking-to-settlement gap nobody talks about
Most operators treat bookings and settlements as two separate problems instead of one continuous flow.
Your booking system shows a $3,200 group tour sold through your website. Clean profit, right? Except that same booking triggers a cascade of financial events spread across weeks: The OTA takes their 18% cut immediately. Your credit card processor holds 2.9% plus thirty cents. The hotel charges rack rate because you didn't hit quarterly minimums. The transport supplier adds a fuel surcharge that wasn't in your original costing. Your guide gets overtime because the group ran late. The OTA settlement arrives 45 days later, minus a currency conversion fee you forgot existed.
By settlement, that $3,200 booking might yield $1,900 in actual cash. Your booking system still shows it as a $3,200 win.
This gap compounds. A typical operator processing 200-300 bookings monthly can lose track of roughly $18,000-25,000 in margin leakage every quarter. Not stolen. Not miscalculated. Just untracked.
Building the minimum viable tracking framework
Forget complex BI tools and enterprise dashboards. You need four connected data points that actually matter:
Never miss a booking or update.
Touryly streamlines your travel bookings, confirmations, and itinerary updates—all in one place.
- Unified booking management
- Automated customer notifications
- Itinerary & staff coordination
No credit card required
1. Booking source truth
-
Booking ID (unique across all systems)
-
Channel source (specific, not generic)
-
Gross amount
-
Net amount (after immediate deductions)
-
Booking timestamp
-
Trip date
-
Settlement expected date
Most operators stop at booking ID and gross amount. That's where problems start.
2. Attribution mapping
Each channel has different margin math. Direct bookings might run 85% margin. OTA bookings closer to 65%. Wholesale blocks maybe 70% but with volume bonuses that kick in quarterly.
Track these as separate streams:
| Channel Type | Base Margin | Volume Trigger | Adjusted Margin | Settlement Lag |
|---|---|---|---|---|
| Direct Web | 85% | N/A | 85% | 2-3 days |
| OTA Primary | 67% | 500 bookings/quarter | 72% | 30-45 days |
| Wholesale | 70% | $50k monthly | 75% | 60 days |
| Affiliate | 78% | 50 bookings/month | 80% | 14 days |
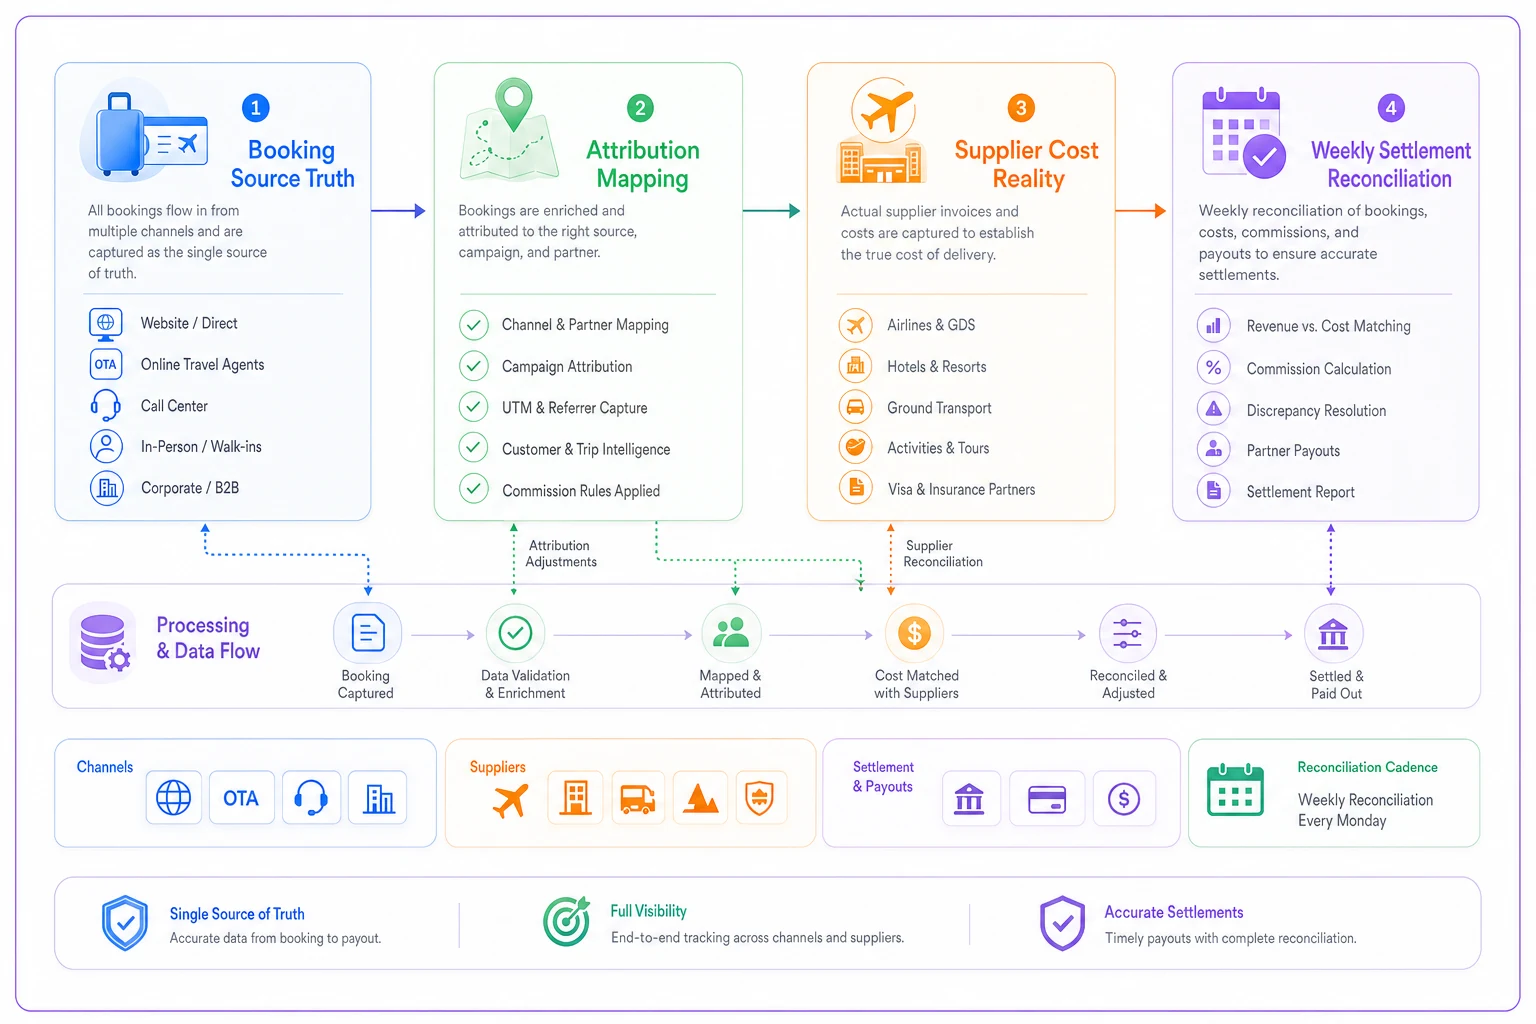
This diagram shows the flow from booking to settlement across the four data points.
The mistake operators make: averaging everything into a blended rate that hides which channels actually make money.
3. Supplier cost reality
Your costing spreadsheet says the wine tour costs $45 per person. But that's the rate from six months ago, for groups of 20+, paid within 7 days.
-
Actual group size
-
Payment terms
-
Seasonal adjustments
-
Currency movements (for international suppliers)
-
Volume tier achievements
Build a simple pass-through tracker:
bookingid | supplier | quotedcost | actualcost | variancereason | settlement_date
One operator I worked with discovered they were losing $12 per head on every small group booking because their supplier pricing assumed minimums of 15, but half their bookings were groups of 8-10.
4. Weekly settlement reconciliation
Don't wait for month-end. By then, discrepancies are buried under hundreds of transactions.
-
What bookings should have settled (based on channel lag times)
-
What actually hit your account
-
What's missing or incorrect
-
What disputes or chargebacks appeared
This isn't accounting — it's operational monitoring. You're watching for patterns, not just balancing books.
The SQL that actually matters
Skip the fancy queries. Three views tell you what's really happening:
SELECT channel, COUNT(bookingid) as bookingcount, SUM(grossamount) as grossrevenue, SUM(netamount) as netrevenue, AVG(DATEDIFF(settlementdate, bookingdate)) as avgsettlementdays, (SUM(netamount) / SUM(grossamount)) * 100 as actualmarginpercent FROM bookings WHERE bookingdate >= DATESUB(NOW(), INTERVAL 90 DAY) GROUP BY channel ORDER BY actualmarginpercent DESC;
SELECT suppliername, COUNT() as trips, SUM(quotedcost) as totalquoted, SUM(actualcost) as totalactual, SUM(actualcost - quotedcost) as totalvariance, AVG((actualcost - quotedcost) / quotedcost 100) as avgvariancepercent FROM suppliercosts WHERE tripdate >= DATESUB(NOW(), INTERVAL 30 DAY) GROUP BY suppliername HAVING totalvariance > 100 ORDER BY total_variance DESC;
SELECT channel, CASE WHEN DATEDIFF(NOW(), expectedsettlement) > 7 THEN 'Overdue' WHEN DATEDIFF(NOW(), expectedsettlement) > 0 THEN 'Late' ELSE 'Pending' END as status, COUNT(*) as count, SUM(netamount) as amountoutstanding FROM bookings WHERE settlementdate IS NULL AND expectedsettlement < NOW() GROUP BY channel, status;
These three queries running weekly catch the majority of margin problems before they compound.
Your tour operator KPI playbook
Stop tracking vanity metrics. Here's what actually predicts whether you'll be profitable next quarter:
Weekly health checks:
-
Booking-to-settlement cycle time by channel
-
Margin variance from quoted to actual
-
Supplier invoice accuracy rate
-
Channel concentration risk (no channel should exceed 40% of bookings)
Monthly operational metrics:
-
Average days sales outstanding (DSO) by channel
-
Supplier payment term utilization
-
Refund rate impact on margins
-
Commission tier achievement progress
Quarterly strategic indicators:
-
Channel profitability after full cost allocation
-
Supplier negotiation leverage (volume vs. pricing)
-
Working capital efficiency
-
Seasonal adjustment accuracy
An operator in Arizona started tracking these instead of just booking counts and discovered their highest-volume channel was actually their least profitable after factoring in settlement delays and commission structures. Shifting focus to their second-tier channels improved cash flow by around 30% within two quarters.
The CSV mapping that prevents chaos
Your booking system exports one format. Your payment processor another. Your accounting software wants something completely different.
| source_system | source_field | master_field | transformation |
|---|---|---|---|
| booking_platform | res_id | booking_id | CONCAT('BP-',res_id) |
| booking_platform | total_amount | gross_amount | total_amount * 1.0 |
| payment_gateway | transaction_ref | payment_id | transaction_ref |
| payment_gateway | net_settlement | net_amount | net_settlement * 0.971 |
| channel_api | booking_reference | booking_id | UPPER(booking_reference) |
| channel_api | commission_amount | channel_fee | grossamount * commissionrate |
This becomes your rosetta stone for data integration. Update it once when systems change, not hundreds of times across different reports.
Warning signs your data model is failing
Watch for these patterns:
-
The percentage drift Your overall margins drop 0.5% monthly but nobody knows why. This usually means supplier costs are creeping up or channel fees are being miscategorized.
-
The settlement surprise Bank reconciliation consistently shows less than expected. Hidden fees, currency conversions, or incorrect commission calculations are eating margin.
-
The volume discount miss You think you're hitting supplier minimums but invoices show standard rates. Your booking aggregation logic isn't matching supplier calculation periods.
-
The refund black hole Refunds process but the associated supplier credits never appear. You're eating the full cost while suppliers keep their fees.
One operator discovered they'd been missing volume discounts for eight months because their booking system counted by calendar month but suppliers counted by rolling 30-day periods. That misalignment cost them roughly $4,200 monthly in lost discounts.
Building attribution rules that scale
Attribution isn't just about tracking where bookings come from — it's about understanding the true cost of each channel at scale.
Start with channel margin reality. That affiliate sending you bookings at 15% commission sounds great until you factor in their 60-day payment terms, 3% chargeback rate, and tendency to book your lowest-margin products. Meanwhile, direct bookings might cost more upfront in marketing spend but settle immediately with minimal fraud risk.
-
Fixed costs pass through at actual
-
Variable costs include a margin buffer
-
Seasonal surcharges get flagged for review
-
Currency fluctuations beyond 3% trigger repricing
The framework looks like:
-
Channel gross margin (after commissions)
-
Minus payment processing costs
-
Minus supplier actual costs
-
Minus operational overhead allocation
-
Equals true channel contribution
Most operators stop at step 1 and wonder why profits don't match projections.
Dashboard specs that operations teams actually use
Nobody needs another 47-widget dashboard. Four views drive daily decisions:
-
Morning settlement check What should have settled yesterday? What actually did? What's the gap?
-
Channel performance grid Each channel's bookings, margin, and settlement lag on one screen. Color-coded by performance against target.
-
Supplier variance tracker Which suppliers are consistently over or under quoted costs? Flag anything beyond 5% variance.
-
Cash flow forecast Based on actual settlement patterns, not theoretical payment terms. When will cash actually hit your account?
The dashboard that finally worked for a 12-person operator in Vermont was almost embarrassingly simple:
-
One number at the top
cash collected yesterday
-
Three trend lines
bookings, settlements, margins
-
One alert section
anything overdue or varying beyond thresholds
-
One action list
what needs immediate attention
Everything else was noise that made people feel informed while missing the actual problems.
Implementing without overwhelming your team
You can't flip from spreadsheet chaos to clean data overnight. Here's a rollout that works in practice:
Week 1-2: Map your current data sources. Document what you have, where it lives, and how often it updates. Don't judge, just document.
Week 3-4: Build the minimum viable connections. Start with booking ID as your universal key. Connect bookings to settlements first, nothing else.
Week 5-6: Add supplier cost tracking. Don't aim for perfection — just get actual vs. quoted costs flowing.
Week 7-8: Layer in channel attribution. Basic at first: which channel, what commission, when settled.
Week 9-12: Refine and automate. Build the queries, create the dashboards, set up the weekly reviews.
Start with booking ID as your universal key.
An operator running around 1,800 bookings annually implemented this progression without hiring anyone new or buying expensive tools. They used Google Sheets for mapping, basic SQL for queries, and a simple webhook setup to pull data from their booking system. Three months in, they'd identified and fixed margin leaks worth $31,000 annually.
Why AI-powered operational software changes the game
The challenge with manual data models isn't building them — it's maintaining them as your business evolves. Channels change commission structures. Suppliers adjust terms. Payment processors update fees. Exchange rates move.
What starts as a simple tracking system becomes a full-time maintenance job.
Modern operational platforms handle this by automating the connection between booking and settlement data. Instead of manually mapping CSV files and writing SQL queries, AI-powered software monitors for discrepancies, flags unusual patterns, and surfaces attribution rule adjustments based on actual settlement behavior.
One operator cut their monthly reconciliation time from three days to about four hours after implementing automated settlement tracking. The system caught commission calculation errors their manual process had missed for months, recovering close to $8,000 in incorrect charges.
The real value isn't replacing human judgment — it's freeing your team from manual data wrangling so they can focus on fixing the problems the data reveals. Your ops manager should be negotiating better supplier terms, not copy-pasting booking IDs between spreadsheets.
Making your tour operator KPI playbook stick
A playbook only works if people actually follow it. A few things make the difference:
-
Assign clear ownership One person owns channel margins. Another owns supplier costs. Someone else owns settlement reconciliation. Clear ownership prevents things falling through cracks.
-
Set weekly rhythms Monday settlement review. Wednesday supplier variance check. Friday channel performance assessment. Same time, same process, every week.
-
Define escalation triggers Margin below 65%? Escalate. Settlement delayed beyond 5 days? Escalate. Supplier variance over $500? Escalate. Clear triggers prevent delayed reactions.
-
Document decisions When you change an attribution rule or update a supplier agreement, write down why. Six months later, nobody will remember the logic.
-
Review quarterly What's working? What's broken? What's changed? Adjust the playbook based on reality, not theory.
Document decisions: When you change an attribution rule or update a supplier agreement, write down why. Six months later, nobody will remember the logic.
The compound effect of clean data
Clean booking-to-settlement data doesn't just fix margin leakage. It changes how you run the whole business.
You start seeing which products actually make money after all costs. Which channels deserve more investment versus which ones you're quietly subsidizing. Which suppliers consistently deliver value versus which ones erode margins through fees and overages you never fully accounted for.
A tour operator specializing in food tours discovered their wine country trips showed 42% margins on paper but actually delivered closer to 28% after factoring in settlement lags and supplier overages. They adjusted pricing, renegotiated supplier terms, and shifted channel focus. Six months later, actual margins hit 38% — not by selling more, but by understanding their real economics.
That's what a minimum viable data model actually does. Not perfect data everywhere, but good enough data where it matters. You can't optimize what you can't see. Once you can see the full flow from booking to settlement, the fixes usually become obvious pretty fast.
The operators who survive the next few years won't necessarily be the ones with the most bookings or the best marketing. They'll be the ones who know exactly where every dollar goes and why. Build your data stack now, while you still have margin to protect.
Margin leakage starts small and compounds quietly. By the time it's obvious on paper, it's usually been eating into your business for months. Your tour operator KPI playbook doesn't need to be complex — it needs to be complete, connected, and actually used. Start with the minimum viable version and build from there.
Ready to elevate your travel business?
Join 500+ travel operators using Touryly to optimize bookings, improve client satisfaction, and grow revenue.